Research Highlight
Three-dimensional electron microscopy reveals new details of membrane systems for Ca2+ signaling in the heart.
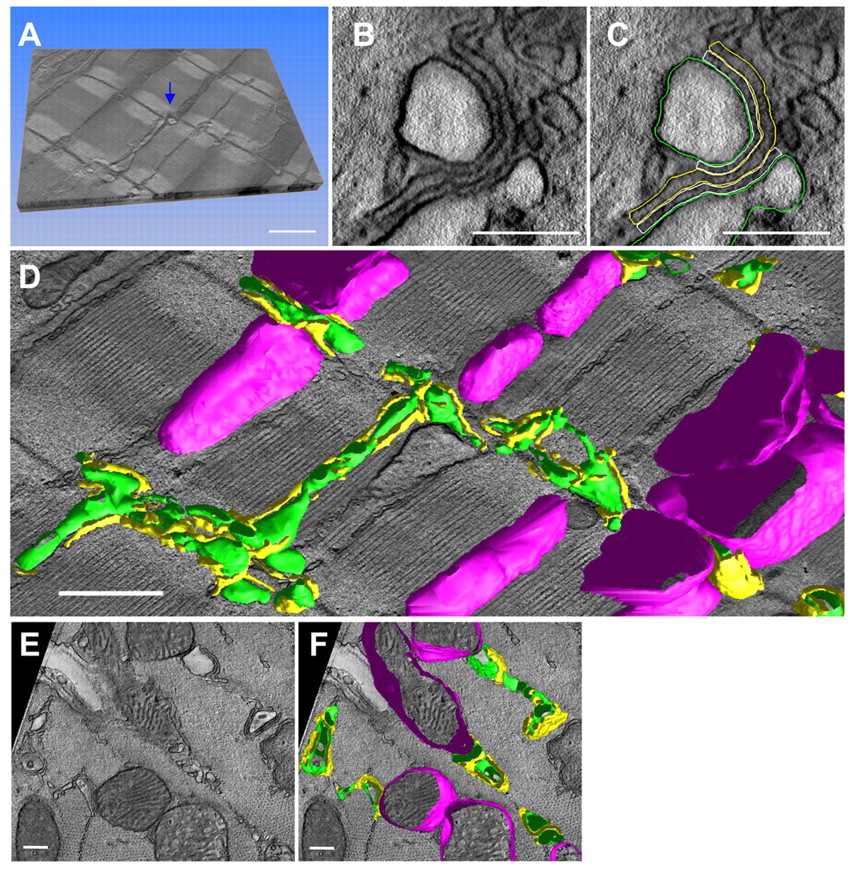
December 2009 — Using electron tomography, the NCMIR investigators in this study mapped the 3D topologies of dyadic clefts and associated membrane organelles in the mouse ventricular myocardium. Morphological details and the distribution of membrane systems, including transverse tubules (T-tubules), junctional sarcoplasmic reticulum (SR) and vicinal mitochondria, involved in controlling cardiac Ca2+ dynamics, were determined.
This research illustrated the geometric complexity of T-tubules and dyadic clefts and provided quantitative details about spacing and size of these components. Electron-dense structures that linked membrane organelles were frequently observed between mitochondrial outer membranes and SR or T-tubules. The authors propose that the topology of dyadic clefts and the neighboring cellular micro-architecture are the major determinants of the local control of Ca(2+) in the heart, including the establishment of the quantal nature of SR Ca(2+) releases (e.g. Ca(2+) sparks).
The Cell Centered Database (CCDB) released two 3D electron tomography data sets from their study of the geometry of membrane systems mediating excitability in cardiac myocytes. Some of the data are available in CCDB under project P1233: http://ccdb.ucsd.edu/sand/main?stype=lite&keyword= P1233&Submit=Go&event=display&start=1. The CCDB is a Web accessible database for high resolution 2D, 3D and 4D data from light and electron microscopy, including correlated imaging. The available techniques range from wide field mosaics taken with multiphoton microscopy to 3D reconstructions of cellular ultrastructure using electron tomography. For each dataset, the CCDB makes available the raw data, reconstructions derived from the raw data and any segmentations and analyses performed on the data. Users may browse the data on-line or download it for re-use within the guidelines of our usage agreement. The CCDB also accepts contributions of data from the scientific community.
Related Publications
Hayashi T, Martone ME, Yu Z, Thor A, Doi M, Holst MJ, Ellisman MH, Hoshijima M. 2009. Three-dimensional electron microscopy reveals new details of membrane systems for Ca2+ signaling in the heart. J. Cell Sci. 122(Pt 7):1005-13.